Analysis of Belgian Shopping Centers: Q1 2026

Belgian shopping centers: Are there new rules?
Visitor numbers at Belgian shopping centers remain consistently strong, but looking only at the overall figures misses the bigger picture.
The analysis of Q1 2026 reveals a clear shift in how, when, and why consumers are traveling. This analysis is based on the national index for shopping centers compiled by The Retail Factory TRF), a European expert in footfall intelligence.
Using innovative technologies and AI algorithms, TRF objectively and accurately tracks visitor behavior to help organizations make data-driven decisions.
By Q1, we mean the official period from January 1 through March 31. To provide the necessary context, we also consider a broader timeframe starting on December 18, which includes the end-of-year period and the sales season. This broader perspective is provided solely for background information and does not affect the formal Q1 calculations.
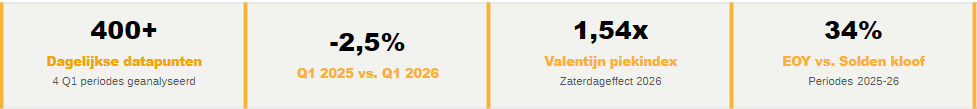
This shows that, after three years of growth, Q1 2026 will see the first structural declineof –2.5%. Visitors are coming at different times, responding more strongly to specific events, and becoming increasingly difficult to predict based on traditional calendars. This does not indicate a downturn, but rather a market that is maturing.
Further growth will not happen on its own; it must be purposefully created .
A turning point for the Belgian retail sector
Q1 2026 shows no sign of a typical economic downturn, but rather a clear shift in consumer behavior.
Shoppers are increasingly less influenced by the traditional retail calendar, and the data clearly reflects this.
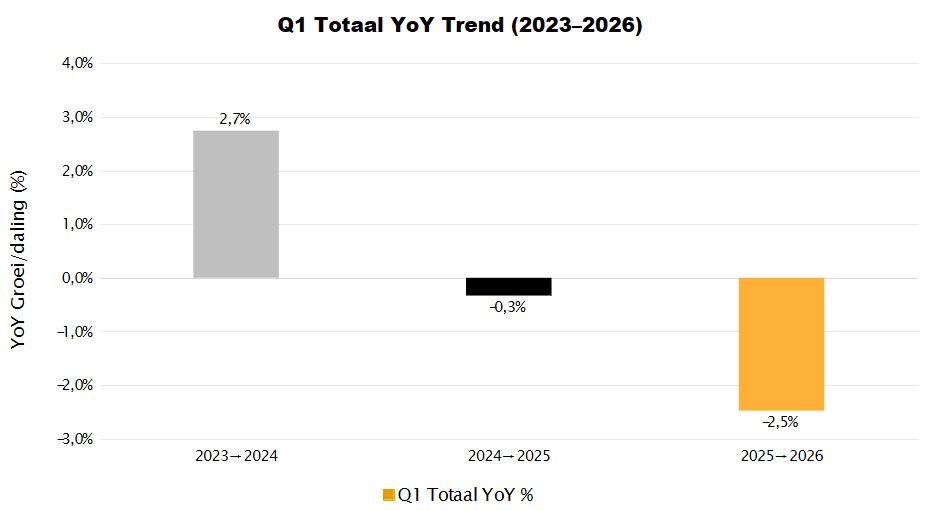
In Q1 2024, growth was still +2.7% compared to the previous year. In Q1 2025, it remained virtually stable at –0.3%.
In Q1 2026, visitor numbers dropped noticeably for the first time, by –2.5%.
The graph shows how visitor behavior continues to evolve and take on new dimensions.
The monthly breakdown makes it even clearer: January –2.1%, February –1.8%, March –3.6%.
Not a single month makes up for the losses. This isn’t a random blip; it’s a pattern.

The growth from 2023 to 2024 was largely due to the “February effect,” with that single month alone accounting for +5.1%. The decline from 2025 to 2026 has no equivalent: all three months show a decline, evenly distributed and without any outliers.
This makes the current downturn structural in nature.
Bundling shifts the focus from January to December
One of the most striking shifts in visitor behavior isn’t in Q1 itself, but in what precedes it. The end-of-year period—from the Christmas rush on December 18 through the week of bundled sales—has undergone a clear evolution in recent years.
While sales used to be the peak shopping season, we are seeing December increasingly take on that role. This shift is largely driven by the growing importance of bundled sales.

In 2022–23, average daily foot traffic during the end-of-year period was still 16.7% higher than during the sales month. By 2025–26, that figure had risen to 34.1%. A doubling over four periods.
Two trends are reinforcing each other: Christmas foot traffic is increasing every year, while the sales are losing ground each year.
The implication is clear: retailers and shopping centers that are still formulating their strategies around January are systematically missing out on opportunities.
The strongest sales days of the year no longer fall during the post-Christmas sales period, but in the week before Christmas. Treat the pre-Christmas rush, cross-selling, and the post-Christmas sales as a single integrated campaign window; a sharp break after Christmas Day leaves commercial potential untapped.
Valentine's Day: The Power of the Weekend
No other event in Q1 illustrates the new rules of the game as clearly as Valentine’s Day. The data shows that it’s not so much about the campaign, the budget, or the decorations; rather, the day of the week on which February 14 falls determines the outcome.
On a Saturday, February 14 attracts 54% more visitors than a typical weekday in February. On a Tuesday, barely 3%. Same day, same event, but a world of difference.
But the day itself only tells half the story. Valentine's Day drives early shopping: visitors buy gifts in the days leading up to it.
The table below shows that the full three-day window, including Valentine's Day itself, provides a more accurate picture of the commercial value for each period.
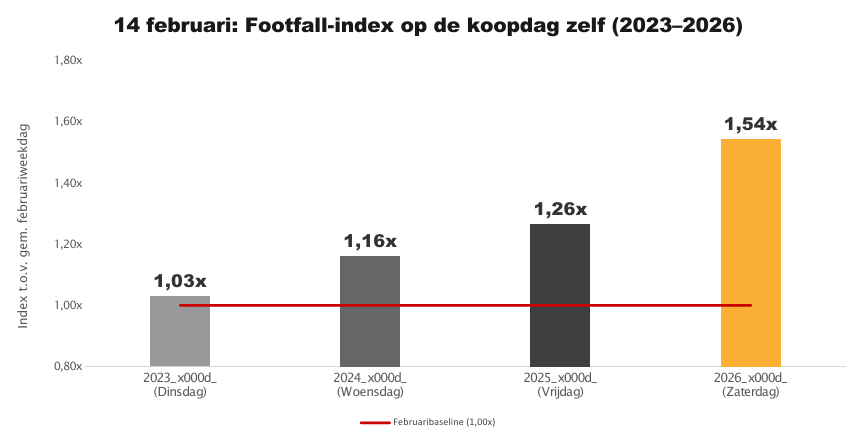

In 2026, with Valentine’s Day falling on a Saturday, all four shopping days outperformed the February baseline. The Friday before already scored 1.19× before Valentine’s Day even began.
The weekend boosts the entire period. In 2023, however, the commercial value of Valentine’s Day was entirely concentrated in the preceding weekend, not on the day itself (1.03×).
Fridays and Saturdays are becoming increasingly dominant.
Saturday dominates the list of peak days: over four Q1 periods, 34 of the 36 busiest days were Saturdays. The two exceptions are both the first days of sales events, where the impact of the event outweighs the day of the week.
Outside of that context, no other weekday ever comes close. Saturday isn’t a trend—it’s a constant.

Over four consecutive periods, the Saturday-to-weekday ratio fluctuates between 1.31× and 1.36×, with an average of 1.34×. In 2025–26, that ratio rises to its highest point in four years: 1.36×.
This is notable in a quarter where total visits are declining: weekdays are losing ground, but Saturdays are holding steady and gaining relative strength.
A new trend is the rise of Friday as a lead-up day to the weekend. Whereas Friday used to be virtually indistinguishable from other weekdays, it now consistently performs better.

The Friday-to-weekday ratio rose from 1.04× in 2023 to a peak of 1.16× in 2025, before stabilizing at 1.11× in 2026. Monday-Thursday volume remained virtually stable over the four-year period; all growth occurred on Fridays.
Friday is evolving into a clear lead-up day to the weekend, with its own commercial value.
The increase from 1.04× to 1.16× shows that Friday is increasingly becoming a “mini-weekend day” with its own commercial value.
This trend can be capitalized on through targeted strategies, such as special offers, promotions, or events, to boost both visitor numbers and revenue.
From Growth to Optimization
After three years of growth, Q1 2026 is experiencing a structural decline. The data reveals a fundamental divide: year-end and Saturdays are growing, while weekdays and sales periods are losing ground. The next phase of growth will be driven by a smarter approach to managing existing visitor flows.
Three factors are decisive in this regard:
1. TIMING:
Knowing when events are taking place is more important than ever.
2. CONTEXT:
The day of the week on which an event takes place also determines how significant the impact is.
3. BEHAVIOR:
Consumers are planning more carefully and spreading out their purchases.
CONCLUSION
Q1 2026 reveals a retail landscape that is maturing. The days of rapid growth are behind us, but the opportunities are greater than ever for those who can interpret the data correctly.
Success in this new reality doesn't mean working harder, but planning smarter:
- Treat the end-of-year period as a single integrated campaign window
- Tailor campaigns to the day of the week and context
- Making the most of Friday and Saturday
- Use 1.34× as the Saturday benchmark
- Retailers and shopping centers that understand these shifts and translate them into concrete actions will make a difference in the coming years.
- The rules of the game have changed. The question is no longer whether there is growth, but who can capitalize on it
SUCCESS THROUGH VISITORS ANALYTICS.
Get to know your visitors and discover how smart data analysis and footfall intelligence enable better decisions for stores, shopping centers, cities, and other locations.
