Logo van The Retail Factory.Neopaul Signs company logo with pink upward arrow above the name.

Show your brand,
measure your potential.

The first smart signage.

Neolytics logo with the tagline 'Where visibility meets intelligence' framed by an orange curve above and a magenta curve below.

The world's first smart illuminated signage.

Neolytics is the world's first smart signage, in collaboration with Neopaul-signs, combining data analysis and visibility.
Thanks to built-in AI technology, the system provides insight into who your passersby are, how they behave, how many enter and how well your location performs.
From visitor and passerby counting to window performance, demographic data and zone analysis, Neolytics helps you understand what works, where opportunities lie and how to create more impact.
With Neolytics, your signage becomes not only visible, but also intelligent — a valuable source of insights to improve your exposure, conversion and marketing efficiency.

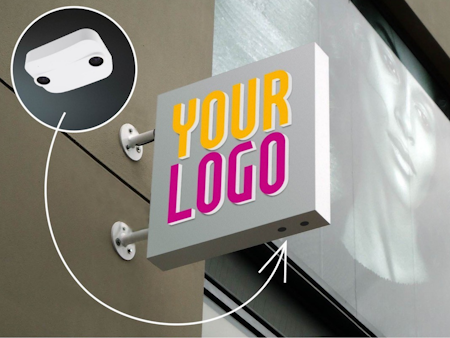
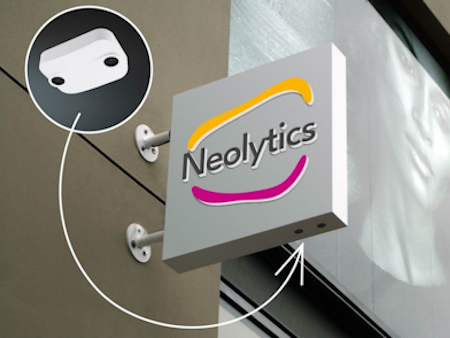
Wall-mounted square sign displaying the text 'YOUR LOGO' in yellow and pink letters with a close-up inset of the dual-lens white security camera attached above it.Wall-mounted square sign with the Neolytics logo in gray, orange, and magenta colors, showing a close-up of a white security camera attached underneath.

Hoe werkt het?

The Retail Factory partners with Neopaul-signs to bring Neolytics to life

  • Smart illuminated signage with built-in AI
  • Discrete / anonymous look
  • Better street-level visibility
  • Cabling included with installation
  • Simplified permit process
  • Visitor and passer-by analysis specific to location and storefront
  • Capture rate and zones-of-interest performance
  • Dwell time, heatmaps and behavioural analysis
  • Personalised dashboards for real-time insight
  • Optimises visibility, conversion and marketing efficiency
Neolytics logo with tagline 'Where Visibility Meets Intelligence' framed by curved orange and magenta lines.
Neopaul Signs logo with a pink upward arrow above the company name on a black background.

Illuminated signage

  • Aesthetic and attractive design
  • Expertise in illuminated signage and signage
  • Creation of visually striking, high-quality installations
  • Customised to the client's requirements
Ontdek Neopaul-signs
Logo van The Retail Factory.

Footfall intelligence

  • Visitor, passer-by and demographic data
  • Data expertise for marketing and customer insights
  • Wide range of measurement tools and reporting
  • 100% GDPR compliant
  • Strategic advice based on data
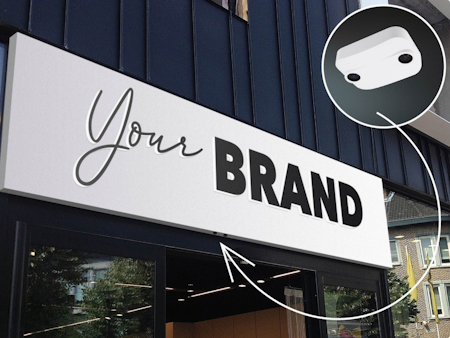
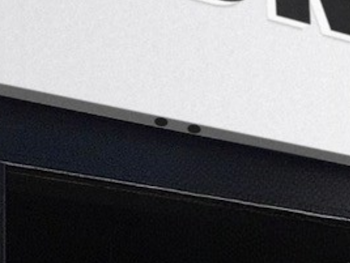
Storefront sign reading 'Your BRAND' with an inset showing a white dual-lens security camera.Close-up of two small black circular sensors or holes on a white horizontal surface above a black area.

Our sensor is fully integrated into the illuminated signage, as shown in the image alongside.
Subtle and discreet, yet powerful enough to accurately measure everything in the surrounding area.

With Neolytics, your illuminated signage and brand become more than visible — they gain intelligence and measurable impact.
You not only have insight into the number of visitors to your store or location, including their characteristics, but also get a broad and complete picture of what happens outside and on the street.

The technology reveals demographic characteristics and behaviour: the number of visitors who walk in, passersby, people who stop to look at your storefront, how long, and much more.

Thanks to The Retail Factory and Neolytics, your illuminated signage becomes a true source of insights to optimise your brand visibility and store and/or location performance.

The insights.

The Retail Factory partners with Neopaul-signs to bring Neolytics to life

With Neolytics, you get a clear picture of what really happens around your store. Our technology measures both passersby and visitors, and analyses how many stop, enter and how long they stay in front of your storefront or store.
You discover your location's potential and know what works — and what doesn't. Whether it's too few visitors, low conversion or high marketing costs without results: with insights into capture rate, storefront and location performance, you see exactly where opportunities lie to improve.

We also provide valuable demographic data, including gender, age estimation, height, group detection and more. You turn your physical store into a measurable, optimisable environment, fully GDPR compliant and 100% data-driven.

White human figure icon below the word VISITORS in orange on a black background.
White pedestrian walking icon below the word PASSERBY in orange on black background.
Icon of three people with a magnifying glass highlighting one person, captioned 'Capture Rate'.
Icon of a house with a striped awning and an orange bar chart above it, with text 'WINDOW PERFORMANCE' in orange.
Map illustration with three location pins and the text 'ZONE OF INTEREST' above it in orange.
Bar chart with an upward trending zigzag arrow indicating improved location performance.
Heat map icon with orange dots of varying sizes inside a white square outline and a location pin at the top left corner on a black background.
White clock icon showing 3 o'clock below the text DWELL TIME in orange on black background.
Demographics icon showing age symbol, male and female figures, and a bar chart with connecting nodes.
Icon of a person riding a bicycle with the words 'CYCLIST COUNTING' above it in orange text on a black background.
White walking pedestrian icon below orange text saying PEDESTRIAN COUNTING on black background.
White truck icon on black background with the title Truck Counting in bold yellow text above.
White car icon with the text 'VEHICLE COUNTING' above it on a black background.
White icon of a clean car with sparkles above and the text 'NEW VEHICLES' in gold on black background.
Three car icons with two white cars above one orange car and the text 'UNIQUE VEHICLES' in orange on a black background.
White car icon with flags of Belgium, Netherlands, France, and Germany representing vehicle origin on a black background.
Graphic with two arrows pointing in opposite directions under the title 'Visitor Flow.'
Heat map icon with orange dots of varying sizes inside a white square outline and a location pin at the top left corner on a black background.

For locations with a car park or pylon sign (also called totem sign), Neolytics technology can also measure other KPIs alongside standard insights.

The system can analyse traffic and visitor flows through measurements such as vehicle and pedestrian counting, origin analysis and heatmaps. The technology works at great heights and is fully weather-resistant, making it perfect for shopping centres, retail parks or stores with car parks.

With this data, you can maximise the effectiveness of your pylon sign or smart illuminated signage, optimise car park management and improve the customer experience — fully measurable and strategically deployable.

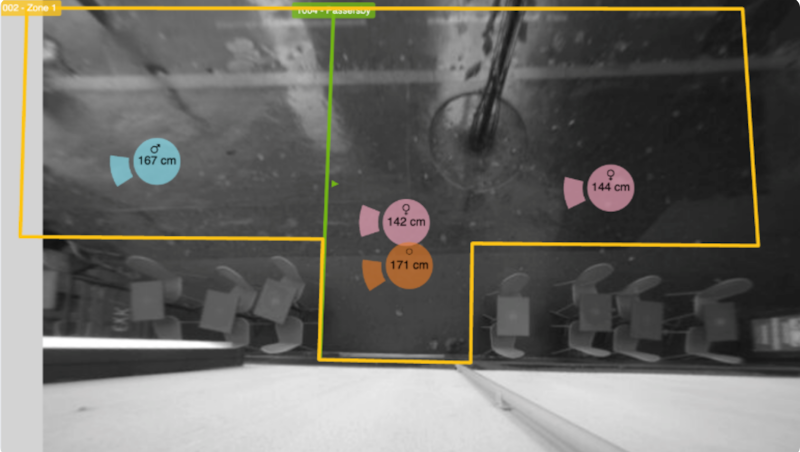
Overhead grayscale view of a room with chairs and tables, showing four detected people marked by colored circles indicating gender and height within a yellow outlined zone.
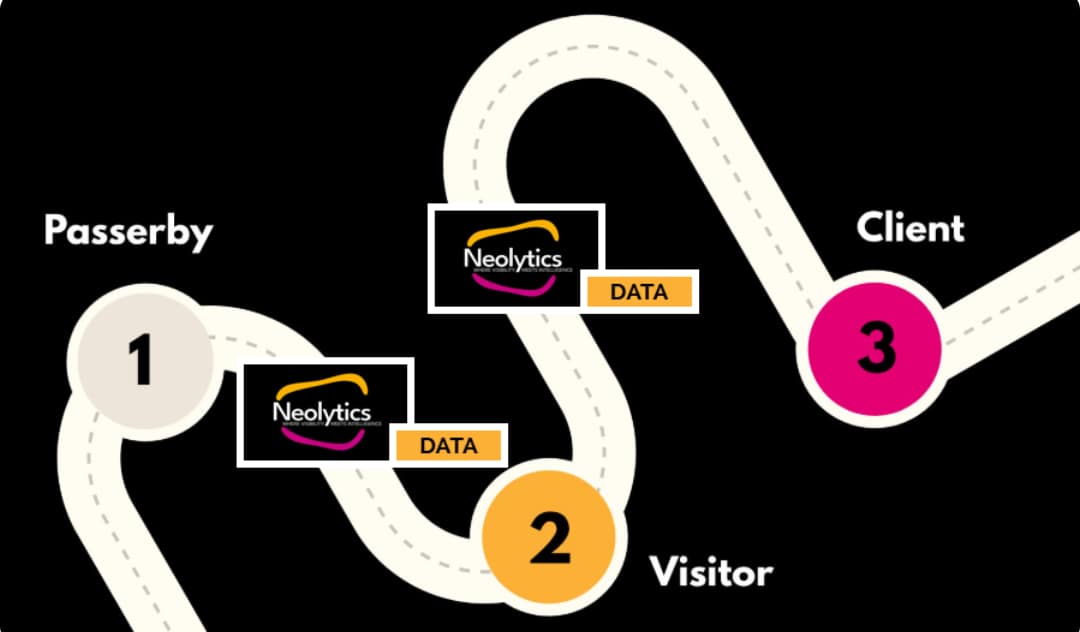
A curved roadmap illustrating the customer journey stages from Passerby (1) to Visitor (2) to Client (3) with Neolytics logo and data labels at stages 1 and 2.

Why Neolytics?

Because it has a direct impact on the customer journey: from passerby to visitor and ultimately customer.
Why is this interesting? Because sales begin before someone even enters the store. Where most retailers only have customer data, Neolytics goes further.
Thanks to our innovative smart illuminated signage with built-in AI technology, we offer unique insights into the complete journey: passersby in front of your store, stopping visitors, incoming traffic and visitor behaviour afterwards.

By combining this physical visitor data with existing customer information, you get a complete picture of your target audience and can optimise every phase of the journey.
You turn potential into conversion, make visibility measurable impact and elevate your retail strategy to a higher level.

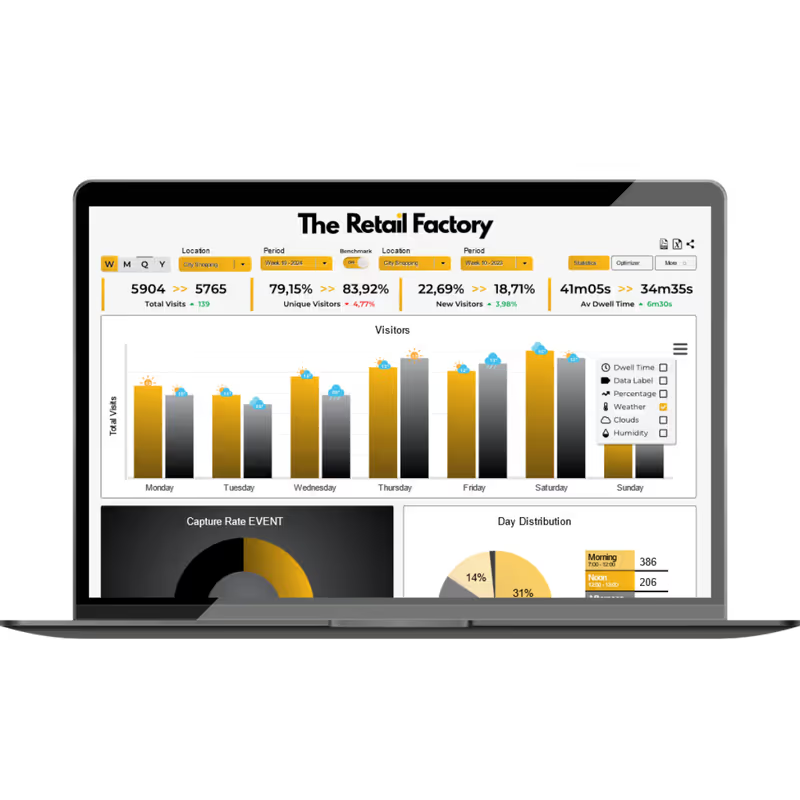
Your data, easily accessible in a personalised portal.

All collected data is processed into personalised dashboards within our portal. This ensures a clear and structured presentation, including visual insights, making strategic and operational decisions easy to take.

The dashboards make it easy to analyse trends in your data.
Data can be viewed by hour, week and month, and periods can be compared with each other.

Laptop screen showing The Retail Factory dashboard with visitor statistics, including weekly total visits, unique visitors, new visitors, average dwell time, and bar and pie charts for daily visitors and day distribution.