
BLANKENBERGE CASE STUDY: HOW DATA SUPPORTS THE STORY OF THIS VIBRANT SEASIDE TOWN

Since the DAKS 2.0 project, the City of Blankenberge has been using footfall counting from The Retail Factory to track how visitors move through the city. The local government aims to use this data to demonstrate the impact of events, strengthen the commercial core, and convince investors with hard figures.
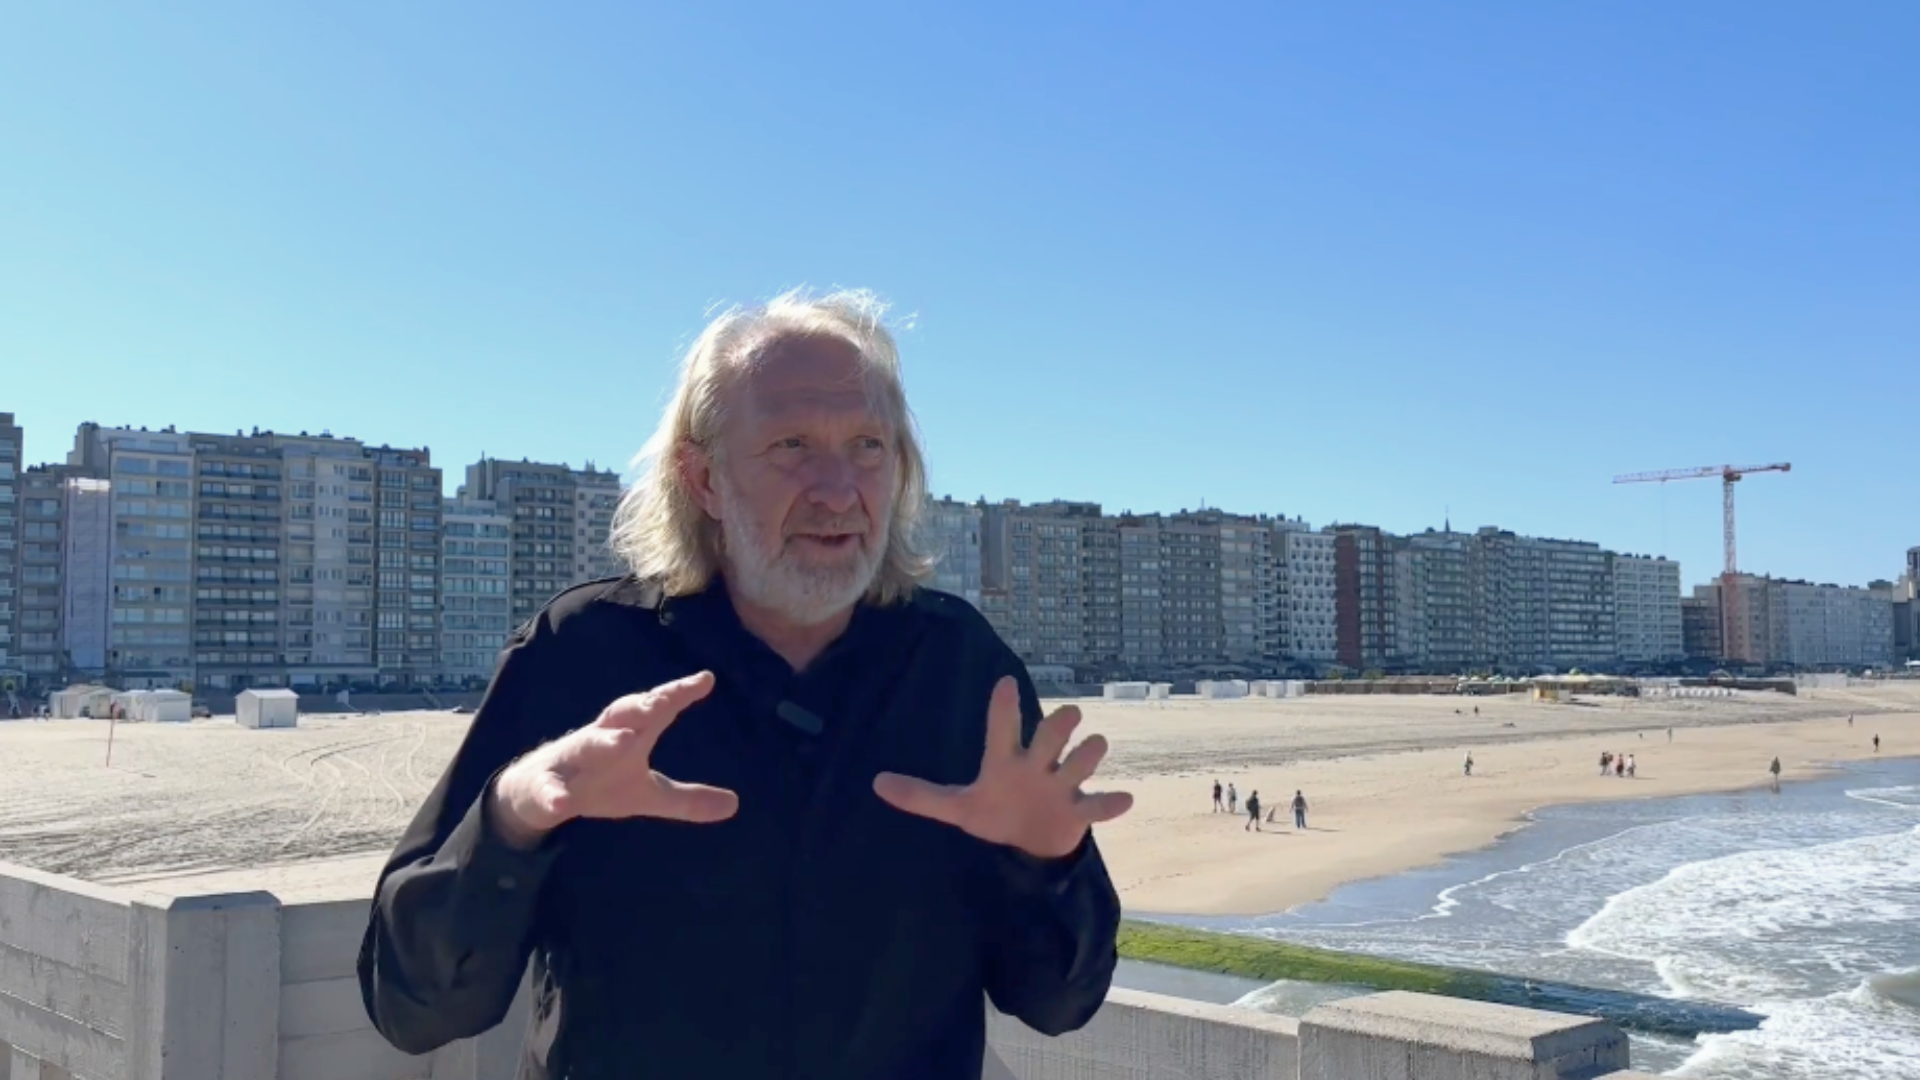
Kurt Penninck has been with the Blankenberge local government for a long time and currently serves as an expert in local economy. In this case study, he explains how the data project came about.
Kurt Penninck, Local Economy Expert, City of Blankenberge:
"By capturing data, we want to provide even stronger support for the great story of Blankenberge."
THE CASE IN BRIEF.
- Client: Local government of the City of Blankenberge (West Flanders, Belgium)
- Sector: Cities and municipalities, coastal tourism, local economy
- Framework: DAKS 2.0, coordinated by KERNpunt and POM West-Vlaanderen, with support from VLAIO and the Province of West Flanders
- Challenge: Demonstrating visitor flows and the impact of events using data instead of gut feeling
- Solution: Anonymous footfall counting at strategic locations in the city center, featuring a data portal with custom dashboards
- Goal: Strengthening the commercial core, providing evidence for events and mobility, and attracting investors
WHY DOES A COASTAL TOWN LIKE BLANKENBERGE WANT TO MEASURE ITS VISITOR FLOWS?
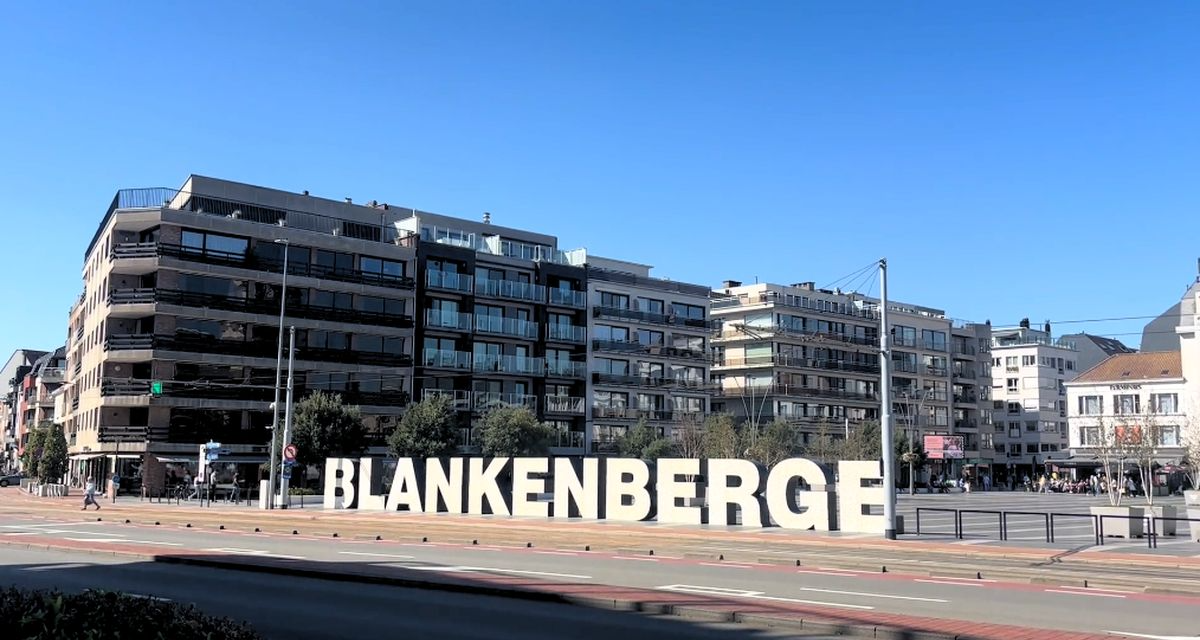
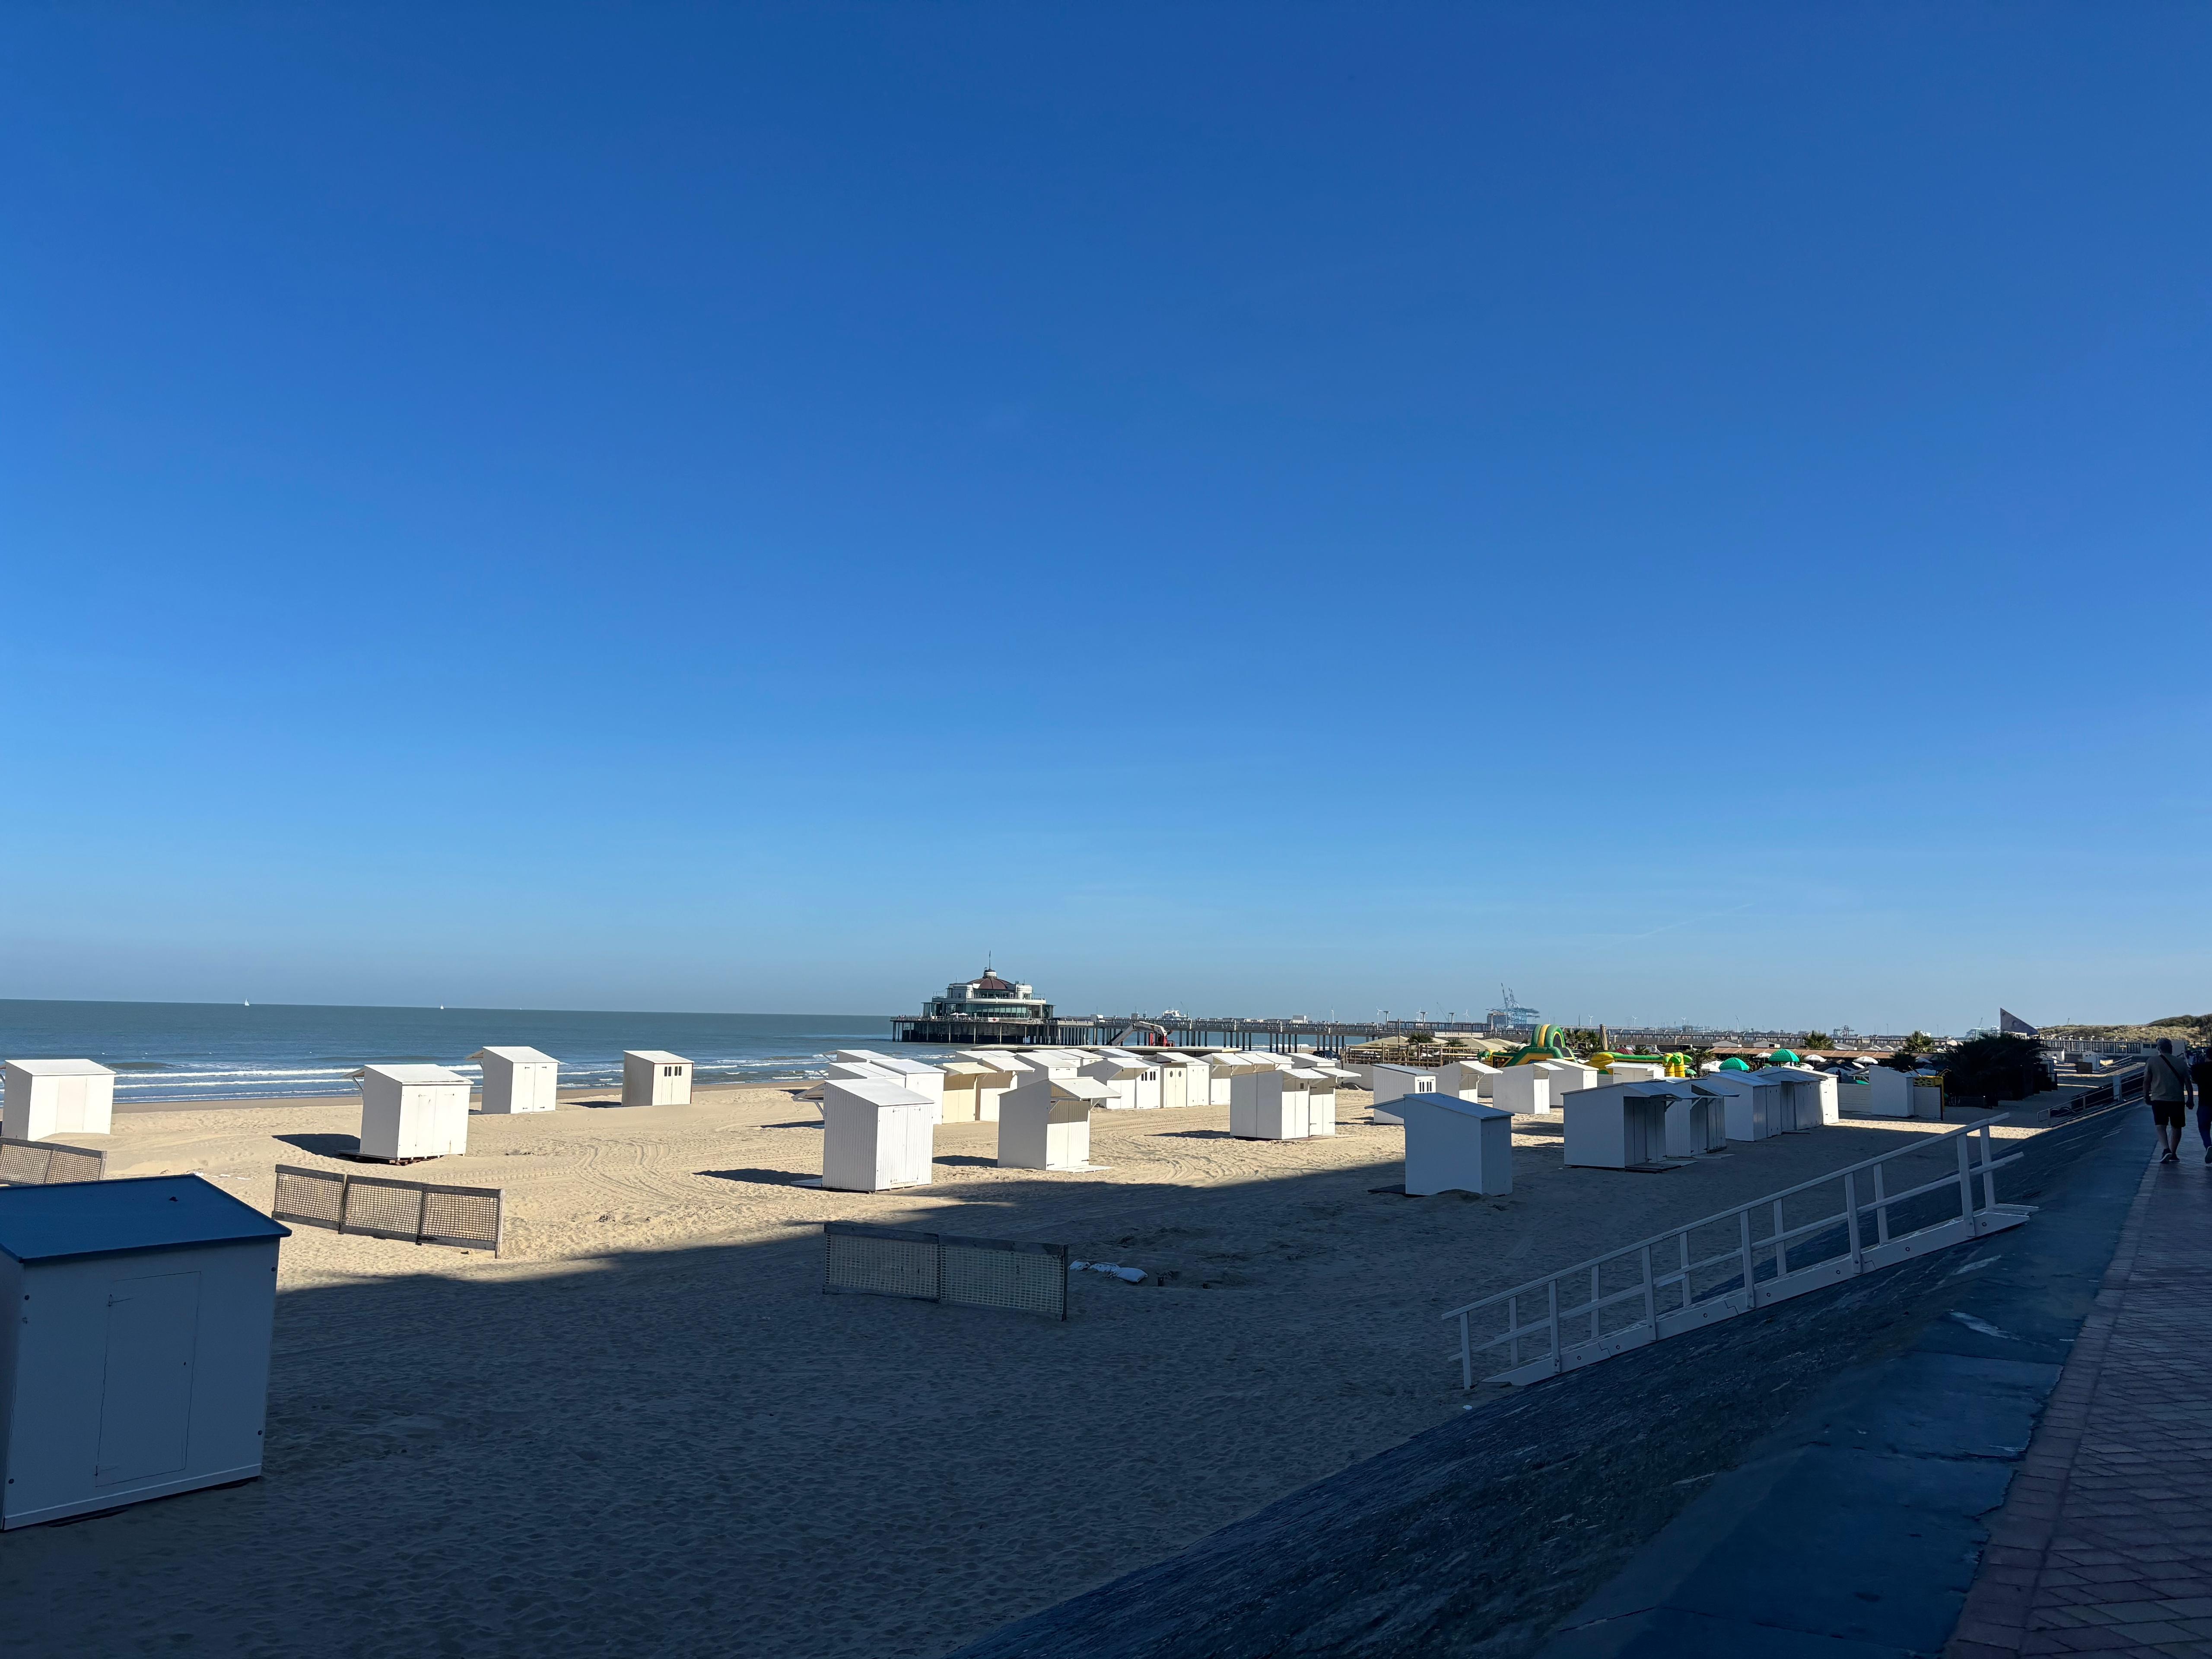
Blankenberge attracts many visitors due to its role as an event-driven seaside resort on the Belgian coast. Every year, large, often multi-day events take place, such as Radio 2 Zomerhit at the Belgium Pier, the Flower Parade, the Harbor Festivals, the Paravang Festivals, and many more. The local government helps manage these events and wants to know what they truly deliver.
This vibrancy is part of Blankenberge's DNA, and the city wants to strengthen it further. For instance, the Belgium Pier is set to host a broader and more varied range of events in the future.
"What is important with all these events and activities is preserving and highlighting our down-to-earth character, our DNA, and the vibrancy of the seaside resort. We cherish that and we want to strengthen it."
WHAT CHALLENGE DID THE DATA PROJECT NEED TO SOLVE?
The local government wanted to be able to substantiate decisions with figures rather than gut feeling. Everyone can see that there is foot traffic in the streets during the summer, and positive media coverage often puts Blankenberge in the spotlight. However, that is not enough to support policy, investments, or events.
For the local economy department, this is a practical question. This department supports entrepreneurs, market vendors, merchants, retail, and the hospitality industry, and needs the right tools to do so.
"We know from gut feeling that there are a lot of visitors and tourists. But that gut feeling is not enough. We also need to be able to demonstrate with figures how those visitor flows move through our city center."
THE CITY SPECIFICALLY WANTS TO KNOW:
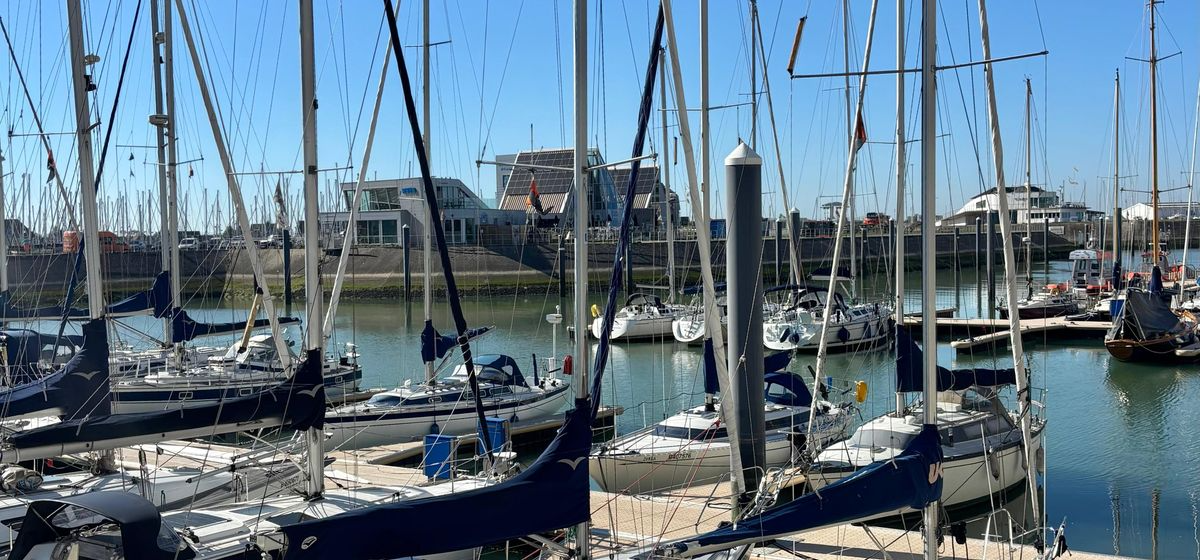
- Where visitors walk: Do they only go from the station via the Kerkstraat to the sea, or do they also find their way to the harbor and other shopping streets in the commercial core?
- When crowds peak: How do the flows fluctuate throughout the year, during events, and during holidays?
- What effect events have: Does an event attract extra visitors to the commercial core?
WHY DID THE CITY OF BLANKENBERGE CHOOSE THE RETAIL FACTORY?
Blankenberge chose The Retail Factory because the proposal was clear and budget-friendly, and because the guidance from the proposal to the dashboard was personal and fast. The project came about through DAKS 2.0 (Data in Small Cities). For the local government, it was an immediate opportunity, even though data was uncharted territory at the time.
FROM UNCHARTED TERRITORY TO AN OPPORTUNITY.
“About two years ago, we were introduced to the DAKS project, Data in Small Cities. As a local government, we knew immediately that it was an opportunity to get involved in that story. We were not yet familiar with data, but it has grown into a very fine result here in Blankenberge, in support of our local economy."
A CLEAR QUOTE WITHOUT ANY FINE PRINT.
“"The quote was very clear. We knew exactly where we stood, with no frills and no fine print. As a local government, we have to be careful with public funds, and we saw immediately that this was budgetarily sound."
DIRECT COMMUNICATION AND WORKING TOGETHER AS PARTNERS.
For a city not yet familiar with data, accessibility was crucial. Questions sent via email or phone were usually answered within 24 hours. For Kurt, a successful data project is all about partnership. The supplier and the local government must build it together.
""If we had questions, whether by email or phone, we received a quick response and could continue building together. And that is exactly what is needed. It is essential that both the company and the local government step up for each other to bring the project to a successful conclusion."
WHAT DOES BLANKENBERGE WANT TO ACHIEVE WITH DATA?
Blankenberge wants to use data to back up its story with hard facts, allowing it to approach investors and partners with more confidence. The data project is currently in full development.
AMBITION 1: Strengthening the commercial core
Which shopping streets visitors reach and which ones they don't
AMBITION 2: Measuring the impact of events
Extra visitors during events such as Radio 2 Zomerhit
AMBITION 3: Planning mobility and parking
When peak times occur and how visitors enter the city
AMBITION 4: Attracting investors
Evidence-based visitor figures for real estate developers and event agencies
HOW DOES A CITY OR MUNICIPALITY START A DATA PROJECT?
Kurt advises other (coastal) cities, municipalities, and organizations to start a data project with a clear ambition and early involvement from all stakeholders.
""If the Booking.coms and Bol.coms of this world are convinced of the importance of data, then that is a clear argument for local governments to start a data project as well."
TIP 1: START WITH A CLEAR AMBITION.
Without ambition, there is no motivation, energy, or drive to bring the project to a successful conclusion. Then, translate that ambition into objectives and concrete actions: capturing, collecting, purchasing, and analyzing data.
TIP 2: INVOLVE STAKEHOLDERS EARLY AND COMMUNICATE IN PHASES.
Involve the executive board and the city council at an early stage, but above all, the local business owners. Ensure merchants know what is coming, and clearly communicate when the next project update will follow.
WANT TO MEASURE VISITOR FLOWS IN YOUR CITY OR MUNICIPALITY TOO?
The Retail Factory helps cities, municipalities, retailers, and shopping centers anonymously map visitor flows, from selecting measurement locations to providing a custom dashboard. Would you like to know what data can do for your commercial center or events? Get in touch to schedule a no-obligation consultation.